The Great Red Spot
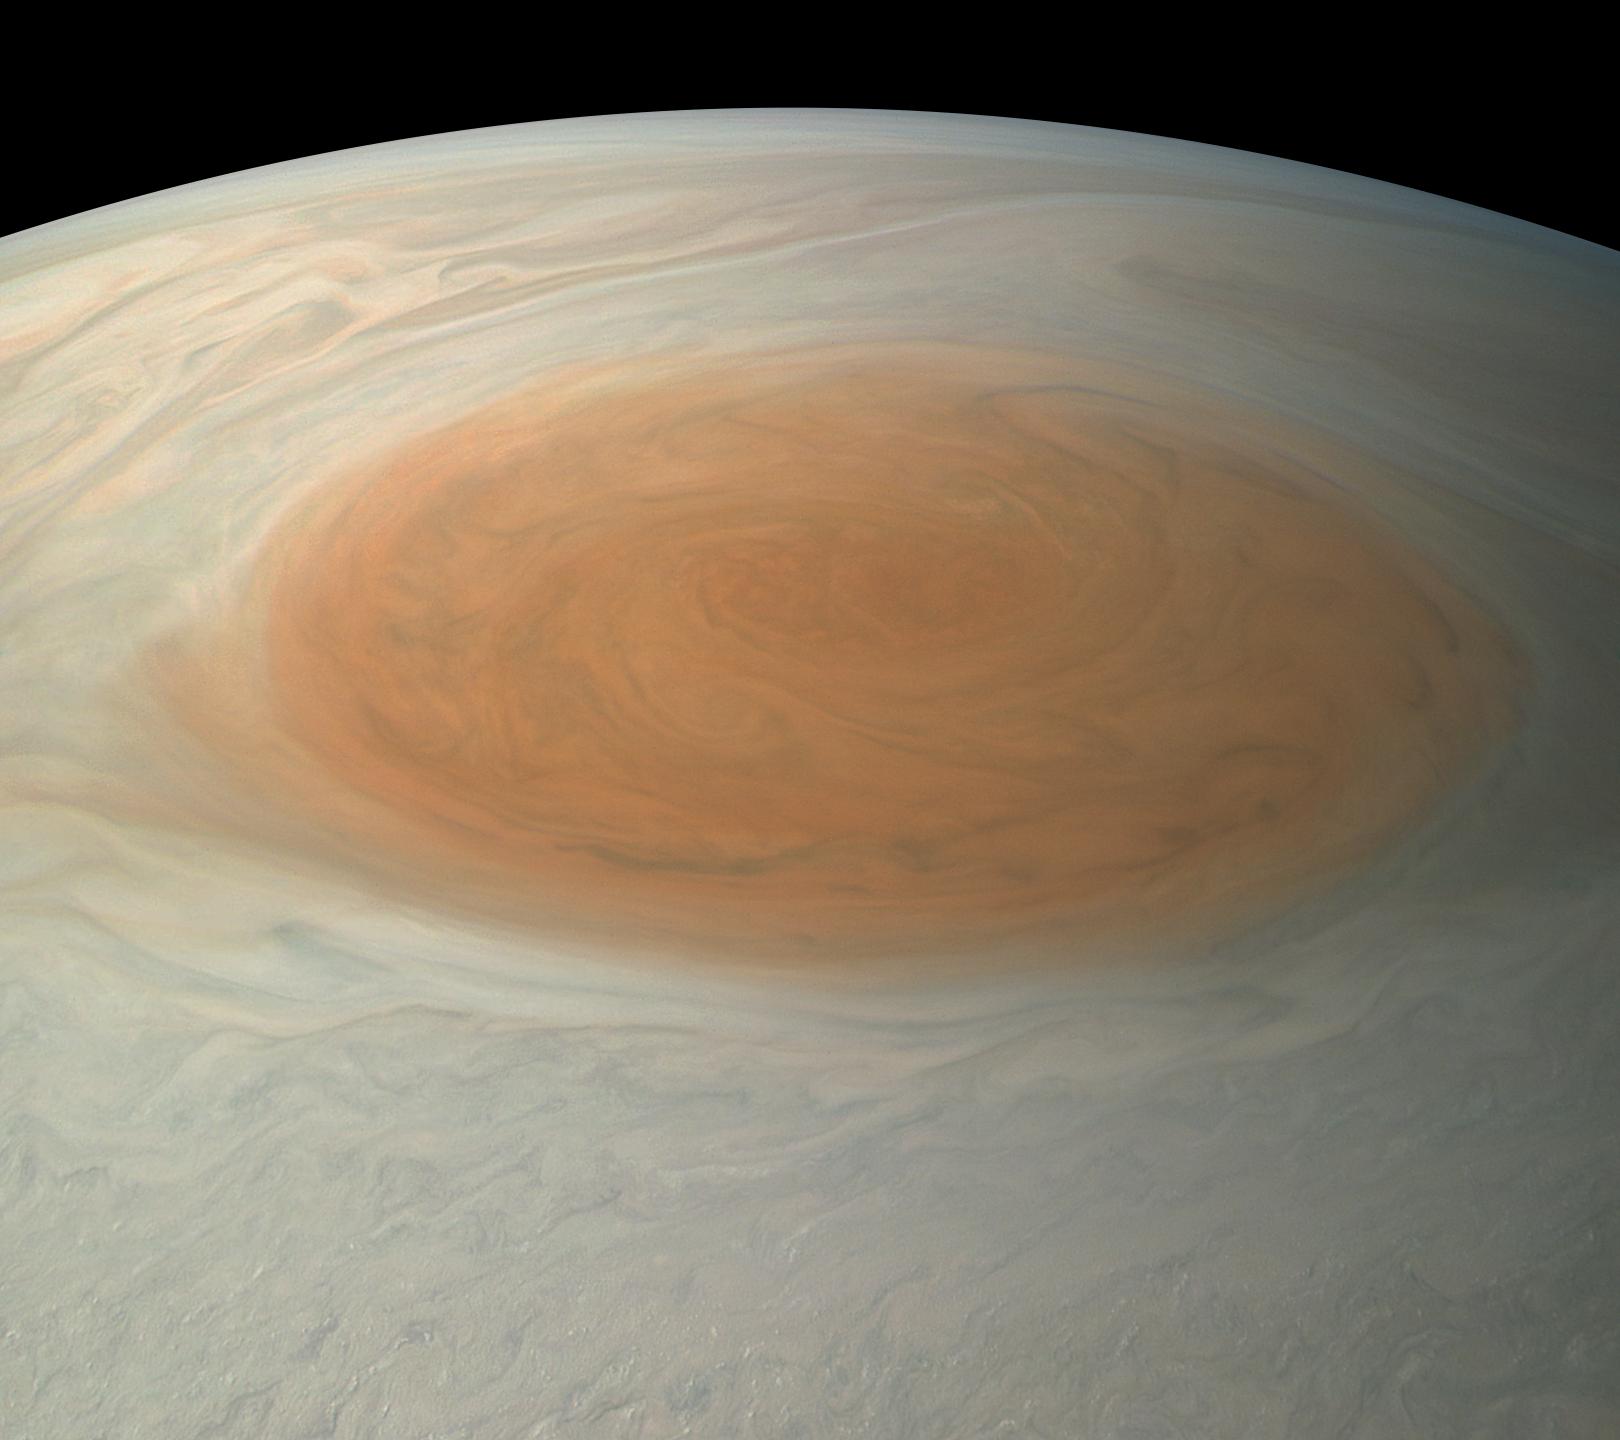
Jupiter’s iconic Great Red Spot (GRS) is actually an enormous storm that is bigger than Earth that has raged for hundreds of years! Fig. 2 below shows an image of Jupiter captured by the Hubble Space Telescope on June 27, 2019.
Jupiter’s GRS has been observed to be shrinking for about the last century and a half! Here is some data of the length of the GRS spanning the last ~150 years which we can use to investigate this phenomenon.
import pandas as pd
pd.options.plotting.backend = "plotly"

url = "https://raw.githubusercontent.com/UBC-DSCI/jupyterdays/master/jupyterdays/sessions/beuzen/data/GRS_data.csv"
df = pd.read_csv(url)
df['Year'] = df['Year'].astype(int)
df.head()
| Recorder | Year | GRS Length | |
|---|---|---|---|
| 0 | Reese | 1880 | 38.6 |
| 1 | Reese | 1882 | 38.5 |
| 2 | Reese | 1885 | 38.5 |
| 3 | Reese | 1887 | 38.3 |
| 4 | Reese | 1890 | 38.0 |
import plotly.io as pio
pio.renderers.default = "notebook"
fig = df.plot.scatter(x="Year", y="GRS Length", color="Recorder",
                      range_x=[1870, 2030], range_y=[10, 40],
                      width=650, height=400)
fig.update_layout(title={'text': "Great Red Spot Size", 'x':0.5, 'y':0.92})
fig.update_traces(marker=dict(size=7))
fig = df.plot.scatter(x="Year", y="GRS Length",
                      animation_frame="Year",
                      range_x=[1870, 2030], range_y=[10, 40],
                      width=600, height=520)
fig.update_layout(title={'text': "Great Red Spot Size Animation", 'x':0.5, 'y':0.94})
fig.layout.updatemenus[0].buttons[0].args[1]["frame"]["duration"] = 200
fig.update_traces(marker=dict(size=10))